THURSDAY, 4 JULY 2019
We begin with a piece by Bryony Yates, on using Earth’s biosphere in the study of life.HUMANS HAVE LONG been fascinated with the natural world, as pre-historic paintings of plants and animals so beautifully illustrate. We can trace formal scientific study back to Ancient Greek philosophers, with Aristotle as the originator of systematic biological investigation. His student, Theophrastus, is considered one of the first ecologists. Travelling throughout Greece, he made many valuable observations about plants: their functions, properties and the importance of factors such as climate and soil to their growth.
As scientific study, including biology, took off in the 18th and 19th centuries, biological specimens were increasingly brought into the laboratory. Scientists and enthusiasts scrutinised them under their microscopes, hoping to unlock the mysteries of life. This form of study, however, had its limitations for understanding how whole ecosystems function.
Sadly, one cannot squeeze a tropical rainforest into a small laboratory; nor will isolating, killing and dissecting its component parts tell you much about this complex, dynamic network. The only way to truly understand an ecosystem is to go out and explore it.
This approach has huge historical and contemporary value. The voyages of Darwin and Wallace, where they observed life’s diversity in its ecological and geographical contexts, were the inspiration behind the theory of evolution by natural selection – a theory underpinning all of modern biology. Even today, survey work, remains the cornerstone of ecology, with ecologists on the ground, trapping, observing and counting. Many readers may perhaps have experienced this, retaining fond (or not) memories of flinging quadrats around a school field. This and other sampling methods have remained relatively unchanged for decades.
However, even these studies are limited in their scope: a team of scientists can never observe every plant, animal and fungus in a rainforest. The sheer amount of labour involved, accessibility issues and numerous other factors make this impossible. Therefore, they must sample what they can and extrapolate (sometimes using sophisticated mathematical models) to draw conclusions about the habitat as a whole. Over the last few decades, new technologies have begun to change this, allowing us to understand biological diversity on regional and even global scales.
Studying the Earth from Space
If you want to see the big picture, sometimes you must take a step back – tens of thousands of kilometres back! Satellites orbiting the earth are used as platforms for remote sensing; the longest-running Earth Observation programme, NASA’s Landsat, has been running since the 1970s. The satellites are fitted with sensors that measure the intensities of various wavelengths of light reflecting off the planet’s surface.
These measurements can be hugely informative. For example, red light is strongly absorbed by chlorophyll (the green pigment in all plant leaves), whereas near infrared light is scattered. Therefore, the ratio of red to infrared light that is reflected from the surface can be used to construct maps of canopy “greenness” to monitor plant leafiness, tree health and detect deforestation.

These techniques are not just limited to the study of terrestrial vegetation. Collectively, marine phytoplankton (tiny photosynthetic algae and bacteria) carry out almost as much photosynthesis as land plants, and yet they are poorly understood and difficult to study. Remote sensing can distinguish different light-absorbing pigments to identify different algal groups and create distribution maps that span the whole globe. These data can also be used to track harmful toxic algal blooms, estimate marine productivity and can even be correlated with other data, such as nutrient abundance and temperature, to help us understand the factors affecting algal distribution.
Satellite imaging is brilliant for mapping ecosystems in 2-dimensional space but to get an idea of the 3-dimensional structure of a habitat, we need to use alternative methods. LiDAR (Light Detection and Ranging) involves an airborne laser that directs pulses of light towards the ground. This light is reflected by the surfaces it hits and a sensor on the aircraft detects this, calculating the distance travelled. This information, combined this with GPS, is used to produce a detailed model of surface characteristics. This can give a useful insight into forest canopy structure, land topography and can even be adapted to measure seafloor elevations, by using water-penetrating green light.
Molecules Matter
Remote surveying provides an excellent way to get a broad, descriptive overview of whole ecosystems. However, it can miss the finer details regarding individual species and their ecological roles. Capturing these requires a drastic change in scale: we must zoom in to focus on the microscopic molecules of life.
The first draft of the human genome sequence was published in 2001. It took many labs several years and an estimated $300M to produce. Now, however, technology had moved on and genome sequencing is faster and cheaper than ever. This has given rise to the metagenomics. In this approach, scientists take environmental samples and sequence all of the DNA present. This is particularly revolutionary for our understanding of the microbial world, which, since so many species cannot be cultured in the lab, is chronically understudied. Metagenomics has yielded insight into ecosystems as varied as the Atlantic Ocean and the inside of the human gut!
The Tara Oceans Project is one of the largest ocean sampling projects to date, and has enabled metagenomic analysis of the global marine microbiome. In 2009, the schooner Tara, set off on her two-and-a-half year expedition around the globe, during which the scientists on-board collected ~35,000 samples from over 200 ocean stations. They collected DNA, morphological and contextual (light, chemical composition etc.) data, focusing on organisms <10mm in size.
To analyse the DNA, two approaches were used. In an approach known as metabarcoding, a specific gene or “barcode” is sequenced from all the DNA collected. The choice of gene is important: it must be present in all species that are being analysed and vary such that it can usefully discriminate between species. This approach shows the number of species in a sample and their relative abundances. Metagenomics, on the other hand, sequences the entirety of the DNA. This is used less frequently, since it is slower and more expensive, but provides a much better insight into what might be going on in these communities: if we know all/ most of the genes each member of the community has, we can then infer their ecological roles. Using these approaches, the Tara Oceans project has vastly expanded our understanding of the marine microbial world.
Metabarcoding revealed new diversity, with ~1/3 of sequences from eukaryotes (cells with nuclei) not matching any known reference. Correlating species data with environmental information has indicated what factors shape community composition; correlating the abundances of unrelated organisms has shed light on hitherto unknown ecological relationships.
Furthermore, identifying common themes between these data and those from the human gut has revealed fundamental properties of microbial communities. Molecular analysis doesn’t stop at DNA, and a suite of new tools are starting to come to the fore. Metatranscriptomics and metaproteomics, the analyses of gene expression and proteins respectively, could allow us to make more reliable inferences about the functional dynamics of microbial communities. This will show us how the genes detected by metagenomics are actually put to use. As the study of our planet’s natural biological laboratory becomes more high-tech, scientists are learning more about living things than Darwin, Wallace and their contemporaries could ever have imagined. We are now able to study huge swathes of biodiversity from beyond the Earth’s surface and interrogate the very molecules that make up its organisms.
However, the field ecologists need not hang up their muddied walking boots any time soon; rather, the future will see them more frequently joining forces with molecular biologists, data scientists, mathematicians etc.
By combining work on Earth’s natural laboratory with that from experimental and digital ones, we can gain truly remarkable insights into the natural world.
Bryony Yates is a third year plant scientist at Newnham College.
How do materials look and behave at high temperatures of thousands of degrees and pressures of thousands of atmospheres? While laboratory reaction chambers may yet be able to create such conditions, Hannah Bryant explains how we may be able to gather clues from the centre of our planet.
The secrets of the Earth lie not only in the complex natural phenomena that govern our weather, landscape and oceans, but also those that occur in the sub-surface. The deeper we descend into the crust, the more uncertain we become about the processes that occur there, due to our inability to reach the depths needed to observe these events first hand. At 12,262m deep, the Kola Superdeep Borehole in Russia the furthest we have reached below the ground, yet it is a mere 0.2% of the Earth’s radius. Thus, when questioning the mechanics of the mantle and core, our only available techniques of measurement are to either replicate these conditions in the lab or to use the Earth as our reaction vessel and try to study it from the surface. This natural laboratory, where the Earth is our sample, can allow us to investigate timescales and conditions that simply can never be replicated in a lab setting.
The mineralogy of the mantle is fairly comprehensively understood. Volcanoes occasionally throw up mantle rocks in the lava that erupt, yielding kimberlite samples from as deep as 450 km below the surface. This process does not extend to core samples and thus the composition and structure of these minerals at the high temperature and pressure conditions they experience is not immediately obvious. Using meteorite samples, which likely share the same composition as the solar nebula from which our planet formed, geochemists have determined the core composition to be largely a mixture of iron and nickel. Since not enough of these elements are present in the crust and mantle, they must be present in the core to enable the same relative proportions of elements as the rest of the solar system.
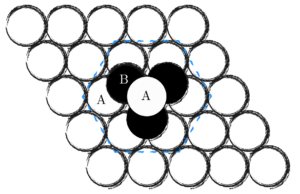 The ‘hexagonal close packed’ structure allows every atom in a lattice to touch 12 others -- 6 around, 3 above and 3 below. This is known as ‘12-fold coordination’.
So, theoretically, iron and nickel should arrange themselves to favour higher density and more efficiently packed structures at high pressures. However, not only is the core deep; it is also hot. An opposite effect takes place when at high temperatures: the particles have more energy and so favour lower density structures that provide more space for vibration. This suggests that at core temperatures, iron and nickel could take up a more open body centred cubic ‘bcc’ structure instead.
So, which is the correct structure? This question is difficult to resolve because there is conflicting evidence in the behaviour of the alloy in simultaneously high pressures of 330 GPa and temperatures of 5700K (close to the temperature of the surface of our Sun).
Perhaps seismic data holds the key. A map of how pressure waves released from earthquakes propagate through the Earth could tell us when the composition of the material they pass through changes. These waves change in velocity when they hit new boundaries such as changes in density or mineralogy and are reflected or refracted depending on the nature of these margins. This enables us to build up an image of the changing layers within our planet. In particular, we can unravel the structure of iron in the inner core by looking at the velocities of waves travelling through it and from this can determine the density. A recent study by Guoyin Shen and his colleagues at the Carnegie Institute of Washington indicated that these shear waves were seen to travel faster through the core when moving between the poles of the core than the equator. This has been termed the ‘seismic anisotropy’ and suggests that the structures must have different alignments along their three crystal axes – a requirement satisfied only by the ‘bcc’ structure.
Seismic anomalies are almost always explained by structural variations in minerals, as the stability of these structures change with pressure and depth. They are thus
a useful tool in probing what the Earth is made of in the deep Earth. But why should we care about knowing these structures in the first place? Crystal structures are closely linked to their material properties, which in turn affect the processes involving them. For instance, seismic anomalies revealed a new material at the base of the mantle, made of magnesium silicate in a distorted orthorhombic crystal structure. It has been shown to have better electrical conductivity than first expected, which directly affects electromagnetic interactions that influences the behaviour of Earth’s magnetic field known for protecting us from solar radiation. Also, thermal conductivity studies showed that heat flows through this material, and hence the base of the mantle, by radiation as opposed to conduction or convection. As the core crystallises, it releases latent heat which drives mantle convection and ultimately plate tectonics. Knowing how this heat is transferred throughout the mantle thus gives us a better picture of the origin of volcanoes, earthquakes, and mountain belts. Seismic studies are also used to explore phenomena occurring closer to the surface, such as plate tectonics. For example,
in places where slabs of ocean crust subduct, or sink, into the mantle underneath another tectonic plate, we see lots of earthquakes originating at unusual depths of up to 670km. This is strange, as the material the slab is sinking into becomes more hot and less rigid with depth; there should be fewer earthquakes, not more. Studies later revealed that these deep earthquakes are caused by cracks forming when a mineral in the slab, olivine, converts to spinel. This transformation should have occurred by 400 km, but because the downgoing slab is so cold, olivine is able to maintain its structure until 600 km where it is begins to be sufficiently heated to turn into spinel. The difference in strength in the two materials causes large cracks to form, releasing energy in the form of earthquakes. This process caused the 2013 Okhotsk Sea earthquake in east Russia, which could be felt as far away as Tokyo, Japan.
Using the Earth to study processes we cannot recreate enables us to better understand how and why natural disasters occur and can allow us to be better equipped to deal with them. There is also evidence to suggest these tectonic mechanisms could be instrumental in the origin of life, as the recycling crust can allow heat and gases to be released onto the ocean floor and provide the vital ingredients for the first cells to begin replication. Studying the way our dynamic Earth moves allows us to therefore not only trace back our planet’s past, but also look into the history of life itself.
Hannah Bryant is a second year Earth scientist at Magdalene College.
Beyond serving as a natural reaction chamber for extreme pressure and temperature conditions, our planet also records vast amounts of data through its dynamic processes. Information on past climate is readily encoded in rocks, trees and ice cores. Atmospheric scientist Andrea Chlebikova tells a story of how we could use this record to probe Earth’s climate conditions in the past – all without fancy time machines still out of our reach.
 Nowadays, we can obtain accurate records of current atmospheric and ocean conditions across many places on Earth in almost real time, thanks to extensive monitoring networks, consisting of remote sensing satellites. If we are interested in what the Earth was like before we began to collate logged data on a large scale, we can start by exploring ship logs, which provide a wealth of weather, ocean and sea ice observations from many different locations in a standardised format. The Old Weather Project, which started in 2010, has turned this into a citizen science initiative, with volunteers digitising and transcribing naval data from the 19th and early 20th century. However, going back much further in time proves impossible to do in this manner, as we are limited by when specific measuring instruments were invented, standardised scales were adopted, and the technology became widespread. The first reliable thermometer along with an associated temperature scale was developed by Daniel Gabriel Fahrenheit in the early 18th century. At the time, not even nitrogen and oxygen had been discovered as elements yet; measurements of trace constituents of our atmosphere did not begin until the late 19th century.
To obtain temperature information that goes back further than a few centuries, or composition information that goes back further than a few decades, we are reliant on using proxies. Dendroclimatology, looking at the properties of annual tree rings to learn about the local climatic conditions at the time, may seem like a far-fetched idea at first – after all, there are a great number of variables that control the growth of a tree, including not just climate factors such as temperature or precipitation, but also individual genetic variation, and local soil conditions. This is true, but by carefully selecting the type of trees examined (trees higher up a mountain are less likely to be limited by a lack of sunshine and rain for example, and more affected by temperature variation, while the opposite applies lower down the same mountain) and by collecting sufficiently many samples (allowing us to account for variation), it has been possible to construct temperature records at annual resolution that go back thousands of years, although we are only able to use this technique in some parts of the world. Interestingly, historical records predating measuring instruments can still serve a useful purpose by providing reference points in the timeline.
We are also able to extract information from ice cores, where historic air samples are trapped in the form of bubbles. The isotopic signatures of the water making up the ice have meanwhile provided us with a way to reconstruct temperature records going back up to 800000 years, as the relative rate at which the different isotopes evaporate, condense, and get incorporated into the ice depends on temperature.
To go back in time even further, we need to look at geological samples, where we may find species representative of a particular climate, or once again temperature-dependent isotopic and chemical signatures. Taken individually, no proxy is particularly reliable, but by seeing how the information we obtain from different sources aligns, we can recreate reliable records of past climates and past atmospheric concentrations of trace gases. The British Antarctic Survey based in Cambridge is one place where such research takes place, with researchers such as Anna Jones and Eric Wolff, among other things, developing ice-core-based proxies and constructing paleoclimate and paleoatmosphere records. It is important to bear in mind that in order to combine and interpret the raw data from the proxies, we are always relying on models to reconstruct the actual climatological variables we are interested in.
In fact, any observation we make in the environment corresponds to the outcome of the many complex physical, chemical and biological processes occurring over different timescales under the specific setup of our planet at the time. It is true that the proxy data is convoluted more than data which is the result of direct observations. However, even to make sense of direct measurements, we rely on using models---otherwise, we would merely be cataloguing information without gaining an insight into the underlying science controlling what we see.
We can nowadays take direct field measurements over a vast range of different conditions, the number and extremes of which we cannot hope to recreate in the laboratory. A difficulty presented by using field research is that we step outside the carefully controlled conditions we try to use in many conventional experiments: we cannot observe the change in one dependent variable as we gradually increase the value of the independent variable and try to keep all other variables constant.
The types of models we have to use for understanding these real-world observations are thus far more complicated and cannot be expressed by means of a simple function, or displayed in a single graph.
But with the aid of increasing computational power, we are now able to use and test even very complex earth system models against observations, though there a few issues. The large number of parameters means large amounts of data are needed to finetune the model. In areas where quality observational data is easily available, this is not an issue, but not all aspects of our planet’s environment are equally carefully monitored. We are also unable to go back in time to install measuring instruments to better study conditions present in the past, though the reconstructed records we have are proving very useful for testing our models, to see whether they accurately predict the phenomena observed within the expected uncertainty. However, for some research problems involving rare events, such as the aftermath of certain types of large volcanic eruptions, we do not have a lot of data to verify our models against. If we use data from all the observations we have for a certain instance of a phenomenon in order to represent it in the model as best we can, we then lose the ability to predict the consequences of this phenomenon in other cases.
To take a step back, there are fundamentally different ways of approaching the problem of modelling a system as complex as the Earth.We can start with our understanding of the physical laws which must ultimately govern it (i.e. a synthetic approach), or we can start with our observations of the complex system and try to build our models around these (i.e. an analytical approach).
A completely undirected analytical approach, for example by using machine learning technologies, is unlikely to prove particularly productive for this complicated a system, and has the additional drawback of rarely providing us with a mechanistic insight into why and how certain processes occur; we may, therefore, lack the ability to predict the occurrence of phenomena that the model was not built around. On a pragmatic level, we also cannot pursue a purely synthetic approach for our planet, at least not at the moment---we simply do not have the computational power to do so. That does not preclude us from including physical processes in a parameterised fashion, or applying them to large volumes at a time rather than individual molecules, but we are then aware that these are approximations, and we need to refine and test them against observations to see whether they are satisfactory. From a philosopher’s perspective, we are therefore using a combination of synthetic and analytical approaches in practice. With the fundamental physical laws governing processes in ‘everyday regimes’ well understood, our focus for improving our models, beyond making them run faster, needs to be on improving the approximations we use by introducing changes and testing simulation runs obtained against unseen observations.
Once again, this highlights the importance of field data to us, and a key question is what kinds of data both our models and scientific understanding would most benefit from. As we are already wishing we had more historical data, what measurements should we focus on collecting now to best help the Earth system scientists of the future?
Andrea Chlebikova is an atmospheric chemistry PhD student at St Catherine’s College.
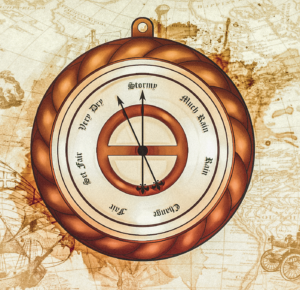
Artwork by Serene Dhawan (algae, barometer) and Seán Herron (atomic arrangement).
