THURSDAY, 12 NOVEMBER 2020
The Origins of Mathematical Epidemiology | Human civilisation has been shaped by infectious diseases. The Black Death claimed at least one-third of Europe’s population from 1346 to 1351, while smallpox from Conquistadors catalysed the collapse of Mesoamerican civilisation. This year, COVID-19 had brought much of the world to a standstill. Without a cure, public health measures to control the outbreak are essential to limit the damage caused by the disease. But which measures are most effective? When should they be deployed? Where? The answers to these questions rely on determining how the disease spreads. Using mathematical equations to simulate outbreaks, we stand a better chance of developing strategies to tackle this ‘invisible enemy’.
Surprisingly, the foundations for modern mathematical epidemiology (the study of the incidence and spread of disease) were not laid by mathematicians, but rather by public health physicians at the turn of the 20th century.
Sir Ronald Ross, a doctor working in India in the late 1800s, discovered the malarial parasite in the mosquito and deduced that mosquitos were responsible for the transmission of the disease. This work won him the Nobel Prize in 1902, but led public health officials to believe that it was impossible to control malaria unless the mosquito population was eliminated. However, by creating a mathematical model of malaria transmission, Ross showed that if the mosquito population was reduced below a critical level, the spread of the disease could be curbed. Based on Ross’s work, policymakers in Panama decreased the mosquito population by draining pools (where mosquitoes breed), screening buildings, and killing adult mosquitoes. As a result, yellow fever was eradicated and deaths caused by malaria were cut-down by over 80% between 1906–1909, a major achievement in public health.
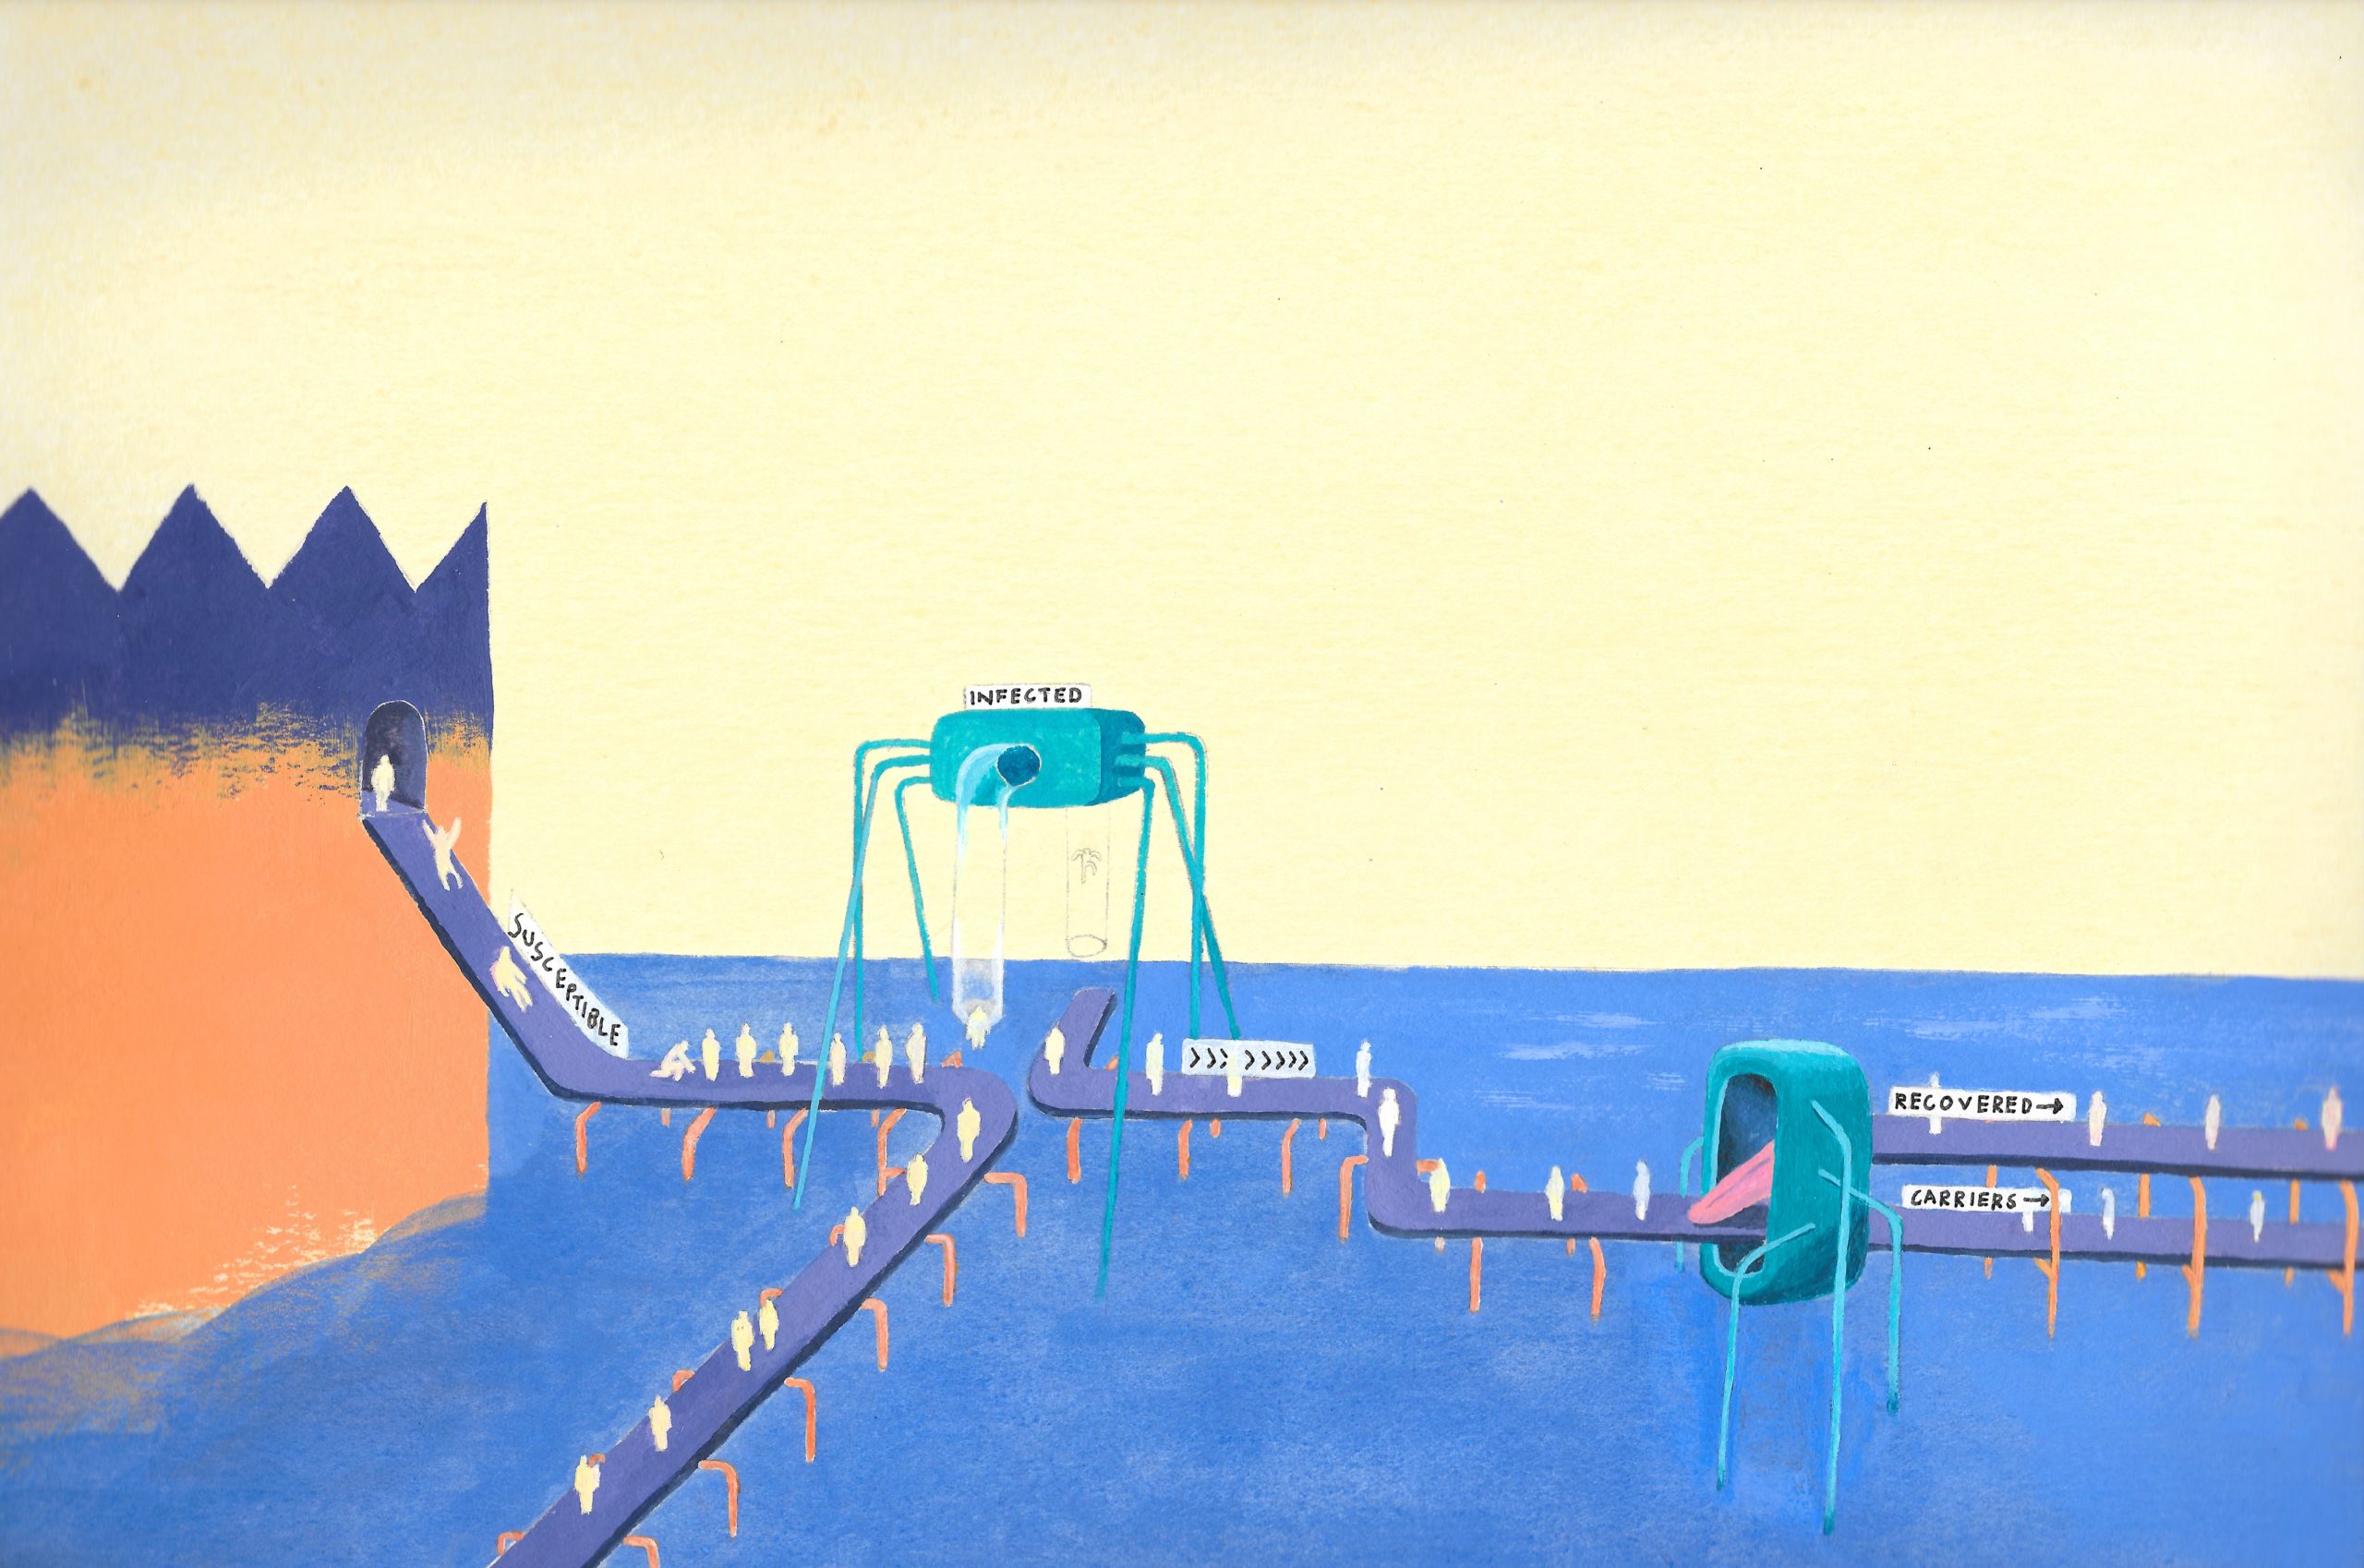
The SIR Model and its Derivatives | One of the main approaches to modelling disease transmission is the construction of compartmental models. These models divide the population into ‘compartments’ which represent the number of individuals at a given stage of the disease. They were pioneered by Kermack and McKendrick in the early 20th century and form the foundation of many modern-day epidemiological models. One of the simplest models they developed was the Susceptible-Infected-Recovered (SIR) model, in which the population is divided into those susceptible to the disease (S), infectious with the disease (I) and recovered from the disease (R). (Note that ‘recovered’ means not infectious, and therefore includes those who have passed away). Using this framework, a system of differential equations is set up describing how the number of people in each compartment changes over time as the infection runs its course. These equations can then be used to find the values of S, I, and R at any given time if we know the initial values.
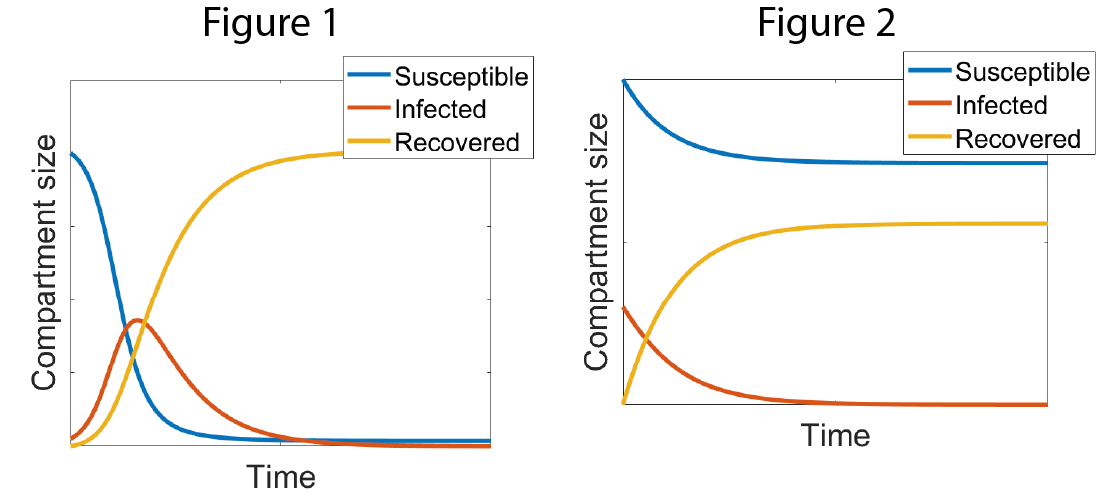
The simple SIR model is powerful because it is easy to analyse and gives a qualitative description of the spread of the disease. One of its most insightful properties is that the nature of the epidemic is dependent on the reproductive number, R0, which denotes the expected number of secondary infections caused by one infected individual in a wholly susceptible population. This number can be derived from the rates of infection and recovery. If R0 is less than 1, then I decays and no epidemic occurs (Figure 1). If R0 is greater than 1, the number of infected individuals grows rapidly and there is a major epidemic (Figure 2).
However, the SIR model describes a generic disease and makes several broad assumptions that may not be relevant to a real-world epidemic or are at the very least oversimplifications. Thus, more complex models are often necessary to reflect the characteristics of a particular disease that is being studied. This can involve modifying compartments and their connectivity. For instance, many diseases have an incubation time where a person has been infected but is not infectious. In this case, an SEIR model is used where E is the ‘exposed’ compartment. Some people who catch diseases such as tuberculosis remain infectious when asymptomatic so a ‘carrier’ state may be added. The flexibility of compartmental models means that it is possible to add an arbitrary number of components to describe the spread of the disease more accurately.
Another way to generalise a model is to account for more heterogeneity in the population. The generic SIR model assumes that all members of the population are equally likely to interact with each other, but in real life this is rarely the case. For instance, age structure is an important consideration when modelling ‘childhood diseases’, such as measles. Spatial structure can arise from the spread of a disease within a city or globally via international travel routes that link certain populations and not others.
These complex models provide a more accurate depiction of the disease and allow epidemiologists to make quantitative short-term predictions that are vital when forming public health policy. However, complex models come at a cost. Complicated models rarely have exact solutions, requiring approximations instead. These models are also sensitive to initial parameters so the changeable nature of viruses and global politics mean that models cannot give concrete long-term forecasts. In addition, they require several parameters which need to be estimated by statisticians. However, when faced with a novel disease, there might be insufficient data to provide reliable estimates. For instance, if one were to model the spread of a pandemic in a country, modelling each town and city would not only take weeks but the data on each town would be so sparse that the cumulative errors in the model would render it useless. As a result, mathematicians need to strike a careful balance between detail and simplicity.
Models in the 21st Century | The boundaries of mathematical modelling are constantly being pushed with modern technology. Increased computational power allows for more detailed models while the prevalence of smartphone technology offers new methods of data collection. In 2018, the BBC conducted two experiments to model the spread of a highly contagious influenza virus: one detailed study of 500 people in a small town and a national experiment with over 36,000 participants. The ‘BBC Pandemic’ app monitored the daily movements of its users and allowed them to submit a list of their contacts, similar in function to a contact tracing app. The results were harrowing — a conservative model with only a 2% mortality projected up to 900,000 deaths, highlighting the vulnerability of the UK to a global pandemic. Information gathered by this unique experiment has provided invaluable data on social interaction in the UK and was used in models of the COVID-19 pandemic.
COVID-19 has highlighted the importance of models and the mathematicians who create them. Their expertise was instrumental in guiding government policy such as the implementation of a lockdown that prevented an overload of the NHS. The challenge now lies in the easing of restrictions and avoiding a second peak of infections. This has become the central focus of modelling efforts. Without a vaccine and the possibility of reinfection, there is a serious risk that COVID-19 outbreaks could become endemic, leading mathematicians to model control measures for a severe winter epidemic. Perhaps the most interesting avenue of research is the inclusion of behaviours in a pandemic model. This involves mathematicians working with psychologists and behavioural scientists to determine factors such as the likelihood of people obeying stay-at-home orders and the effects of prolonged isolation.
Ultimately, the role of mathematicians and epidemiologists is to suggest control measures and provide clarity for policymakers, so that the consequences of their strategy and guidelines are well- understood. This epidemic has highlighted the need for expertise and requires the whole of the scientific community to work together with politicians to find favourable solutions, where there is no obvious answer.
Shavindra Jayasekera is a third-year undergraduate student in Mathematics at Trinity College. Artwork by Josh Langfield. Graphs by Shavindra Jayasekera.